UsingSRTM Terrain Data
1 Background to dems in Rail3D
1.1 See also
1.2 Overview
My general verdict when I wrote up dems for the User Guide was along the lines of “it can be done, but it probably shouldn’t.” Since that time, the situation has changed a bit, and it is starting to look as though DEM data could make a very valuable contribution to layout modelling for Rail3D. In particular:
- Rail3D now has built-in distant terrain simplification, so terrain points distant from the camera don’t have the killer effect on framerate that they used to have, and we have a need to populate large areas with “coarse terrain”, especially on mountain layouts.
- Previously, it was very difficult to get high-resolution dems for areas outside the usa. With the availability of 3-arc-second data from the nasa srtm project we have a free source of data covering most of the world at a resolution more than adequate for Rail3D.
- I’ve written a little tool that does all the hard work for you…!
2 srtm Data
nasa’s srtm (Shuttle Radar Topography Mission)1 project used a radar interferometry technique to measure the surface of the earth from space. This has its limitations:
- the radar has trouble with dense clouds
- the vertical resolution is only about 15m
- it doesn’t work at high latitudes, so it won’t be much help to fans of the Kiruna iron ore trains or the White Pass & Yukon.
Fortunately, it is possible to fill in the holes and tidy up the coastlines by interpolation techniques, and some of the data now available on the internet have been “cleaned up” this way.
- Note that the coastline-clipping process is not very accurate, at least for uk data — you may find that the edge of the dem area has shifted a few hundred metres compared to the coastline on the map.
However, we should be realistic: the srtm data are great for distant mountains, or for places where you simply don’t have topographic maps, but they may need quite a bit of hand tweaking near to the track - 15m is rather a big bump for a train!
2.1 Getting the data
You can download srtm data from the usgs Seamless data distribution site http://seamless.usgs.gov/. However, I wouldn’t recommend this: their server responds very slowly, and you’ll need a lot of patience to use the overcomplicated interface.
If you want raw, unfiltered data (clip your own coastlines…), try ftp://e0mss21u.ecs.nasa.gov/srtm/
A better option in most cases is the Centre for Tropical Agriculture CGIAR-CSI. (Please note that this is an academic server intended for researchers — don’t abuse their hospitality by downloading big chunks of data you don’t need!)
They simply have a map where you can select the 5×5 degree chunk of the earth’s surface you want, and then you just have to choose between GeoTiff2 and ArcInfo ascii 3 formats. Both of these formats can be read by the Rail3D coordinate Tool. The binary GeoTiff format can be handled much more efficiently and is the best bet for most purposes.
For example, tile (36,02) covers Wales and most of England. Go to the ftp download site ftp://srtm.csi.cgiar.org/ and grab srtm_36_02.zip from the Data_GeoTiff directory. The files are about 40MB each, and take about 30 to 45 minutes to download on my broadband connection. (If you want to try it out but don’t have a fast connection, look for a tile with a lot of sea on it — they are smaller!.)
For more details of how to manipulate srtm data, see SRTM- The Hard Way.
2.2 MicroDEM
Professor Peter Guth’s freeware program MicroDEM4 is useful if you want to visualise dem files, or do tricks like merging several GeoTiffs into one big file. It’s not essential if you just want to import terrain into Rail3D.
3 Extracting the data
When you’ve downloaded the srtm zip file, unzip it to a convenient place (if you have MicroDEM, use the mapdata\dems folder that was created when you installed MicroDEM).
4 Converting to Rail3D format
Essentially, what you have to do is:
- Get the dem data into a format you can edit
- Transform the latitude and longitude from the wgs84 datum to the datum of the particular grid system5
- Convert from latitude and longitude to the Mercator projection of the grid system
- Shift the coordinates to take into account the “false origin” you are using in Rail3D
- Select the data points you need for your layout
- Put the data in Rail3D’s
terrain X Y Z format and paste them into Rail3D.
The Rail3d Utilities#toc3 can do most of this for you.
5 A Practical example
5.1 Setting up in Rail3D
I built a little model of the former Holmfirth branch (L&yr). The first stage was to put together a composite map to use in the Digitiser as a guide for the track and topography. I use a simple sketch map to illustrate the principle here, but in real life you would of course use whatever good quality topo-map you have available.
Open the map in the Digitiser, calibrate it, and save the calibration, as usual. Holmfirth is conveniently near to the south-western corner of National Grid square se, so we simply choose point se 000 000 on the map to correspond to (0,0) in Rail3D space — this reduces the rsk of confusion considerably!
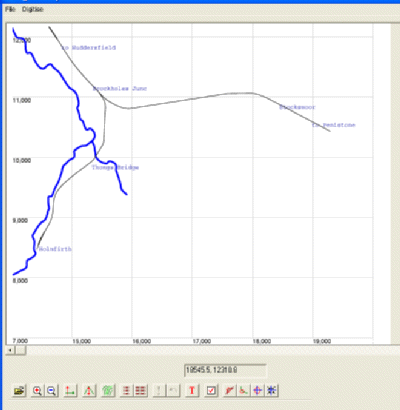
Rough map open in the Digitiser.
At this point it’s a good idea to put a few text labels into our empty layout so that we will be able to move around easily once we add some terrain. Save the layout.
The modelled area will extend from roughly se 140 080 to se 190 120 (14000,8000 to 19000,12000 in Rail3D).
We will want our terrain area to be a bit bigger than this. There are no very high mountains in the area, so adding on a kilometer on each side is probably more than enough to avoid any sightlines that go “off the end of the world”.
5.2 Setting up in the Coordinate Tool
The Coordinate Tool can open your saved Digitiser session directly (click on “Open Map”). It knows how the map relates to your Rail3D layout, but it doesn’t know how your layout relates to the real world. You therefore need to “Georeference” the map.
You can do this graphically, if you like, by selecting a point on the map and entering its real world coordinates, but in this case there is an easier way: in the main Coordinate Tool window, make sure that os (Great Britain) is selected, then simply enter the grid square letters se in the small edit box under Rail3D Coordinate Offset and click on Save. This creates another small index file, so you don’t have to remember the georef data next time you open the map.
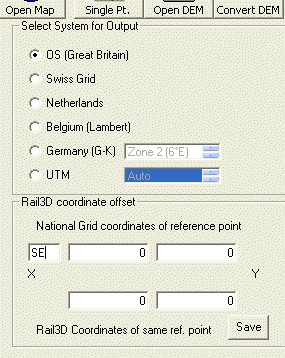
Georeferencing your map
5.3 Loading the dem file
The next step is to load up your dem data into the Coordinate Tool. The file S_36_02.tiff covers most of England and Wales, fortunately including the West Riding (different in so many other things from the rest of the world…).
Note: the Grid Coordinates shown here are fully-numeric references realtive to the origin of the National Grid. Subtract 400km from both Easting and Northing to get references in square se.
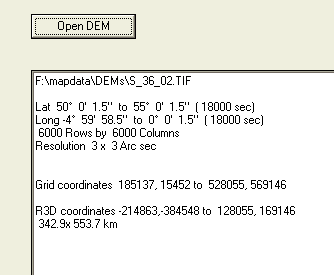 dem
dem Summary
When we open the file we first get a warning that GeoTiff support in the Coordinate Tool is a bit of a bodge, but trust me: it works fine with unmodified srtm files. Then we get a summary of the data in the file. This is a useful plausibility check: If the area of Rail3D space we need isn’t covered by the file, then we’ve either got the wrong dem or made a mistake entering the coordinates.
5.4 Selecting the area we want
As you can see, the dem contains 6000×6000 elevation points. This is more than enough to kill your layout dead in its tracks: we need to select a small subset covering the layout area we identified above. You can do this either by dragging a rectangle on the map or by entering coordinates directly in the main window.
We also need to choose the resolution we want: the dem contains a point every 3 arc seconds, i.e. roughly every 90m. You probably don’t need so much detail in a layout — I’d suggest you choose 6 or 9 seconds. The effect of this is simply that the program arbitrarily skips some of the data points. At 6 seconds we reduce the number of points by a factor of four, and so on.
Note that 1sec corresponds to about 30m in the North-South direction: East-West the points get closer together as you get further from the Equator.

Select the resolution
5.5 Convert
Press the Convert button when you have set up all your settings. The program asks for the name of a text file to save the data into. If you press the “Overlay terrain points on map” button, you get a preview, with the points coloured to give you a rough idea of the height distribution.
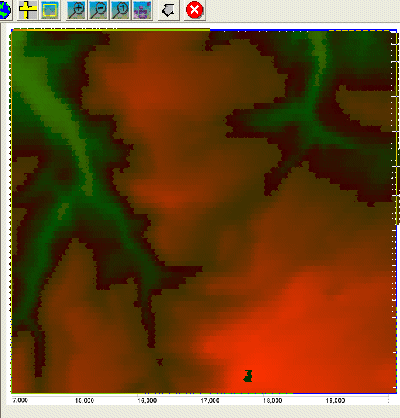 dem
dem preview showing relative elevations
This is another useful plausibility check — we can recognise the shape of the Holme valley (about 100–130m) on the left of the map, with Stocks Moor rising to about 230m in the middle, so we know we haven’t got it totally wrong!
The resulting terrain points are saved in the text file and we can see them on the Convert tab:
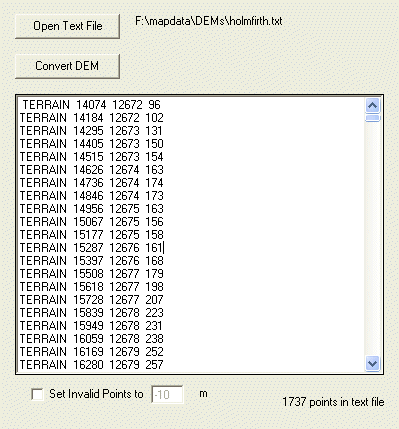
First few lines of output
Notice that I have created 1737 data points — this isn’t a problem for such a small area, but for a big layout we would have to be careful to reduce the density of points a lot further than this.
107L5.6 Paste into Rail3D
Select all the data points in the output (either in the Convert tab or by opening the text file in an external editor), copy them to the clipboard, and then paste them into your Rail3D layout (Edit>Paste). It will take a little while for Rail3D to process the points. Once it has finished, save the layout under a new name.
In the Digitiser, you can see how the points you’ve added match up to your layout:
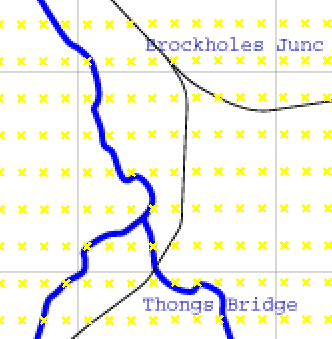
Digitiser with “contour” view turned on.
Notice how the lines of points don’t quite line up with the grid — this is quite normal and results from the way the National Grid works. If you look in the margin of an os map you’ll see how \”Grid North\” is always a little different from True North.
Click “Generate Terrain” to create some actual Rail3D terrain from all these points.
The result looks fairly good, but there are a couple of obvious problems:
- When you lay track, you will get some very deep cuttings and high embankments. Remember: srtm data are only accurate to ± 15m.
- The valley bottom has a lot of transverse “fold” lines across it. This comes from the 180m spacing between terrain points — in most cases there are points on either side of the valley, but not in the middle.
- If your layout includes coastlines, they may not be in the right place (the clipping problem).
- You may find a few terrain points that are way out (e.g. −500m or +6000m)
To improve the terrain, we need to do quite a bit of “touching up” in the area near to the track. Get out your contour map and apply the standard “terrain tweaking” tricks:
- Use the terrain eraser to get rid of dem points within about 50–100m of the track. Add terrain points manually from the map as necessary.
- Make sure the track is correctly graded. Once you’ve done this, run a terrain-setting train along it to stitch all the sections that are not marked as cuttings and embanments on the map.
- Build and grade rivers along the valley bottoms (see Rivers In Terrain).
- Inspect, tweak, backup, regenerate, inspect, tweak, backup, regenerate,…
6 The Result
Importing srtm data doesn’t save you all the work of building terrain. You have to accept that you will have to do a fair amount of hand-tweaking in the area near the track. However, it does make it a lot easier to fill the background and middle distance of your layout with realistic terrain. The regular lattice of points created by dem import also seems to be a bit less susceptible to unpleasant artefacts than hand-contoured terrain.
Mark Hodson April 12, 2006
import